Navigating the Report Generator
Use the Report Generator to do the following:
Creating a Report as a Spreadsheet or a Chart
Before creating a report, review the overview in Report
Generator.
then do the following:
- Set up Hierarchy and
a Date Range for the
report.
- Select a program.
- In the upper right corner of the web page, select a survey source
or select All. .
- In
Report Generator, select a View.
- Depending on the View you
selected, select a Report Filter option from either Group
By, or Disposition.
For example, select CRS. The
selection turns blue
 with
a checkmark by it, and a dropdown list appears.
with
a checkmark by it, and a dropdown list appears.
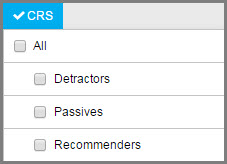
- Select any of the checkboxes in the dropdown list.
 All
Report Filters include a dropdown list except for Date,
or the CMP, or API
checkboxes.
All
Report Filters include a dropdown list except for Date,
or the CMP, or API
checkboxes.
- Do either of the following:
- To select an entire Selection
Group, grab the
 and
drag the group onto the canvas.
and
drag the group onto the canvas.
- To select individual Attributes,
open the appropriate Selection
Group and drag it onto the Canvas by doing either of the
following:
- Place your mouse on the white arrow
 and drag the Attribute
onto the canvas.
and drag the Attribute
onto the canvas.
- Place your mouse anywhere on the attribute label
 and drag onto the
canvas.
and drag onto the
canvas.
A checkmark appears by each of the Attributes
you selected. 
 To remove unwanted Attributes
see the next section, Removing
Attributes from the Canvas.
To remove unwanted Attributes
see the next section, Removing
Attributes from the Canvas.
- Click
 , and then in the Report Preview window, click
Print.
, and then in the Report Preview window, click
Print.
Only the
first 10 rows are shown in the preview.
- To
save the report, enter a name at untitled
template and then click the Save
icon.

- To
download the report as an Excel file, click the
 icon.
icon.
- To
view the report as a chart, click
 .
.
The Create Chart window opens.
- Click the tab for Pie,
Line/Column, or Bar.
- In the tab you selected, select the variables you want for the
chart, and then click Create Chart.
The chart is displayed.
- Do any of the following:
- To return to the Create Chart window and make changes, click
 .
.
- In
the Enter Report Name
field, enter a report name and click

To
view your saved chart report, go to Menu
> Data Management > Report Generator - My report.
- Click
 .
.
- To
include the report image in an email, click
 .
.
Enter the email address, subject, and message, and then click  .
.
- To return to the canvas, click
 .
.
Removing
Attributes from the Canvas
To remove Attributes from the
canvas during report creation:
- To remove individual Attributes,
do either of the following:
- Hover over an Attribute,
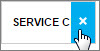 then click the X that appears .
- Drag the Attribute
into the
 icon at the bottom of the page.
- To remove all Attributes
from the canvas, click the icon.
The image changes to 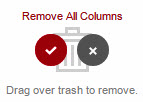
- Click the red checkmark.
All Attributes are removed
from the canvas.
Updating
Saved Reports
You can update a report you have previously saved as:
To update a report that you saved as a template:
- Click the down arrow near the Save
icon
 , then select the report from the dropdown
list.
, then select the report from the dropdown
list.
- To modify the report, do any of the following:
- Add or remove attributes in the report.
- Depending on the report's View,
change the selection at Grouped
by or at Disposition.
- Click the Save icon.
- To clear the canvas and create a new report, do either of the following:
To update a report you saved as a chart:
- Go to Menu > Extract Tools
> My Report.
A list of your saved chart reports is shown.
- Open the report you want to view and change the date range.
Changing
the date range is the only change available in a saved chart report.
See also:
Report Generator
About Survey
Dates and Import File Dates