 The data
shown in the graphics in this user guide is test data, and not reflective
of TME data.
The data
shown in the graphics in this user guide is test data, and not reflective
of TME data.To view the Crosstabs report, click Menu, and under Data Management, click Crosstabs.
Use Crosstabs to build reports by drawing on all the data in TME ClearView.
 The data
shown in the graphics in this user guide is test data, and not reflective
of TME data.
This topic includes information on the following:
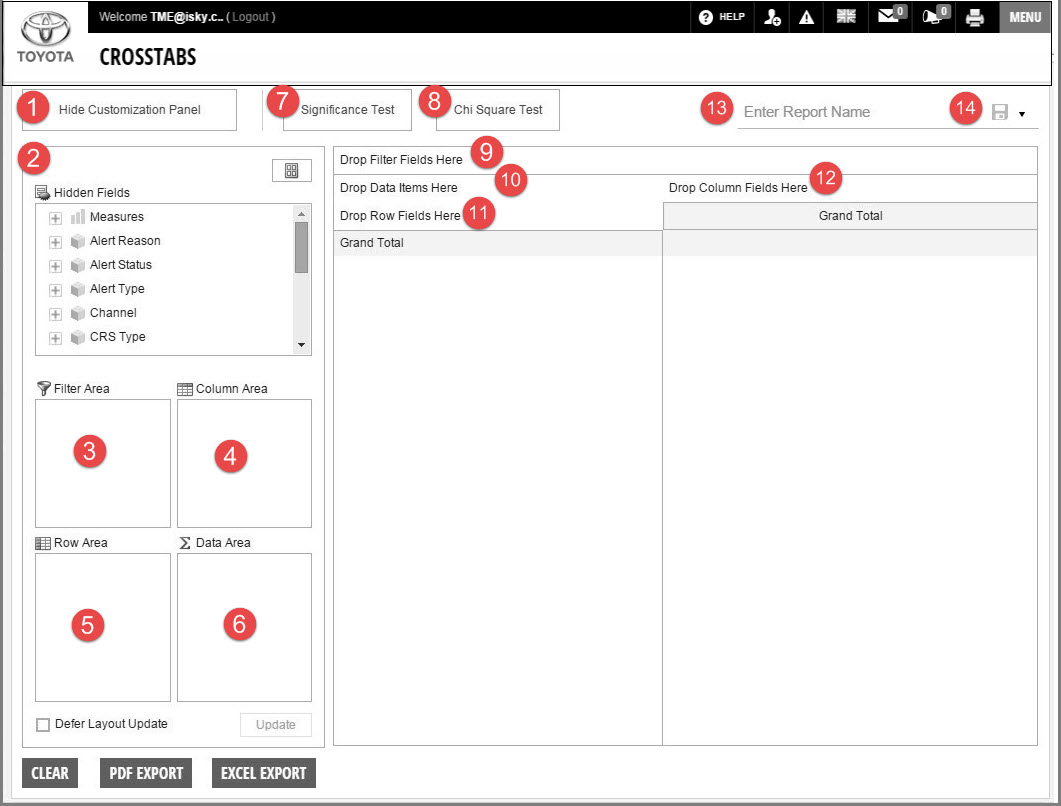
The sections of the Crosstabs report page are numbered in the following graphic. The numbers in the graphic are referred to throughout Crosstabs Help topics for clarification and are shown as a number in parenthesis, for example, the Column Area (4).
The Crosstabs report page includes three main sections:
The left column, which includes numbered items 2-6.
The middle column, which includes numbered items 9-11.
The right column which includes one numbered item 12.

The Hidden Fields list (2) shows a list of items that can be dragged into the report. The Hidden Fields list includes two types of items:
To view data, you must include a Measure in a report. You can drag Measures into either of the following:
If you drag a Measure into Data Area (6), it's immediately visible in Drop Data Items Here (10).
![]() A Measure cannot be dragged into Row
Area (5) or Column Area
(4).
A Measure cannot be dragged into Row
Area (5) or Column Area
(4).
After you have dragged measure into the report, you can drag Dimensions into the report as filters, columns, or rows.
The table below shows the locations to which you can drag a Dimension. The Dimension is then shown in both the area or the drop fields here location.
| Drag Filters here | Drag Columns here | Drag Rows here |
| Filter Area (3) | Column Area (4) | Row Area (5) |
| Drop Filter Fields Here (9) | Drop Column Fields Here (12) | Drop Row Fields Here (11) |
To remove Measures and Dimensions while creating a report, do either of the following:
 .
.
See also:
Creating Basic Reports in Crosstabs