Provides this information and actions
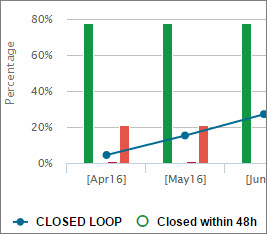
A line and bar graph in which the bars show the monthly number and percentages of each Closed Loop status, over a six-month period. The line graph indicates the total number of Closed Loops generated for the month, and includes all statuses.
The left side of the graph shows percentages, and the right side shows counts.
To filter your view by status, click a status icon from the row of icons at the bottom of the graph. For example, click
 for
Late . The bar graph displays Late Closed Loops.
for
Late . The bar graph displays Late Closed Loops. Hover over each bar or point of the line graph to see a tip window that shows the counts and percentages of Closed Loops for each status.
Click the widget title or points in the line graph, and the Closed Loop List opens showing Closed Loops in all statuses.
Click a bar graph, and the Closed Loop List shows Closed Loops corresponding to the status of the bar you clicked.
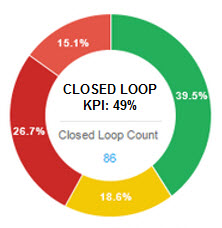
A color-coded circle graph shows percentages of Closed Loops, and shows the KPI percentage and count in the center of the circle.
Hover over a colored section to see a tip window that shows the number of Closed Loops and their time frame.
Click a colored section of the graph, and the Closed Loop List report opens filtered by the section you clicked.
Click the widget title or the blue count number inside the graph and the Closed Loop List report opens showing all Closed Loop statuses.
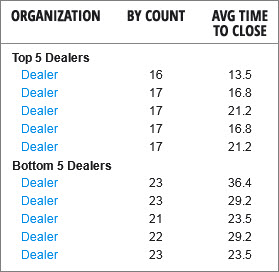
Shows the top five and bottom five dealers based on the number of closed loop alerts. It also shows the average time to close Closed Loops for each dealer.
For detail, click a dealer's name, and the Organization Summary report opens, showing the dealer you selected.
Click the widget title and the Organization Summary report opens.
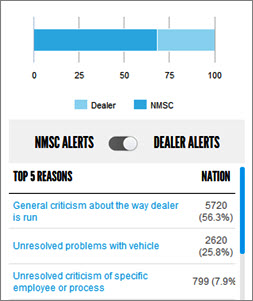
A bar graph shows the ratio of Closed Loops divided between the dealer and NMSC.
 The graph includes
only the number of escalated Closed Loops whether at the NMSC
or dealer level.
The graph includes
only the number of escalated Closed Loops whether at the NMSC
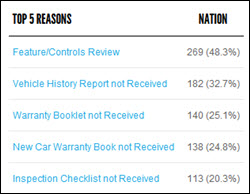
or dealer level. Click the toggle bar to select the top five Closed Loop reasons for either NMSC or the dealer.
The top five reason for Closed Loops are are shown with counts and percentages.
Click a reason, and the Closed Loop List report opens to the reason you selected.
Click the widget title and the Closed Loop List opens.
A list shows the top five reasons for Closed Loops related to a product, and provides counts and percentages.
A reason is considered product-related when a Closed Loop is opened, and Product is selected as the Type.
Click a reason, and the Closed Loop List report opens to the reason you selected.
Click the widget title and the Closed Loop List opens.